
If you’re on the path to becoming a Splunk Enterprise Certified Architect, you’ve probably discovered that the Splunk Enterprise Deployment Practical Lab isn’t your typical certification exam. This is a 24-hour practical exam designed to assess your skills and knowledge, serving as the final step toward Splunk Architect certification. Unlike multiple-choice tests, this hands-on challenge requires you to build a complete Splunk distributed environment from scratch according to specific requirements.
This guide provides a strategic 6-day preparation plan using a Docker-based lab environment that mirrors the actual exam setup, helping you develop the muscle memory and confidence needed to succeed when the clock starts ticking.
What Is the Practical Lab?
The Splunk Enterprise Deployment Practical Lab is a 24-hour practical exercise where each participant receives access to a specified number of Linux servers and a set of requirements. You must then build a complete mock deployment that adheres to Splunk Deployment Methodology and best practices.
Here’s what makes this exam unique: You have a WebEx call during the first 4 hours with a Splunk trainer who introduces the lab challenge, provides server details, explains the assessment process, and answers clarifying questions. After that initial window, you’re on your own to complete the configuration work within the 24-hour time limit.
Most experienced candidates complete the lab in approximately 4-5 hours, but having the full 24 hours gives you time to troubleshoot issues, verify configurations, and ensure everything meets the required standards.
Once the 24 hours expires, the instructor grades your work to determine if your configuration meets the required standards and follows best practices. This isn’t just about getting Splunk running, it’s about demonstrating that you understand why certain configurations are recommended and can implement them correctly.
Understanding Your Docker Lab Environment Architecture
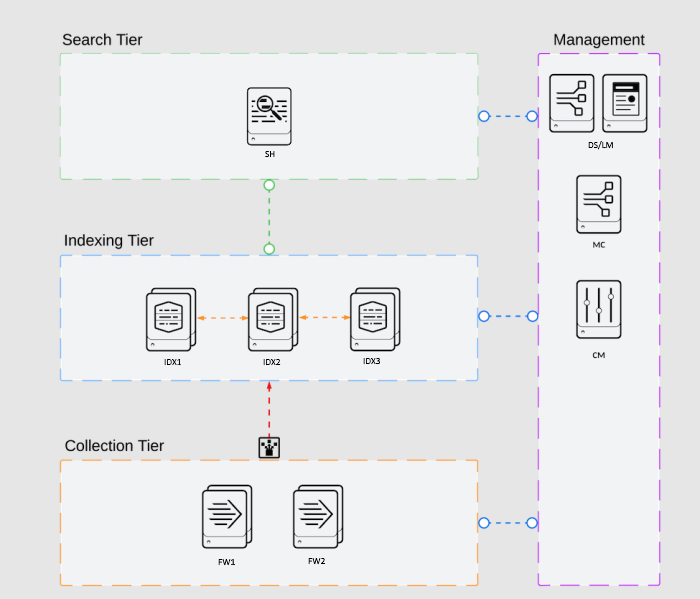
The provided Docker Compose configuration creates a complete Splunk enterprise architecture with ten containers representing different Splunk components. This setup closely mirrors the actual practical lab environment:
Management Layer:
- ds_lm (Deployment Server + License Manager): This container combines two critical management roles. Running the Deployment Server and License Manager on a single instance is acceptable and practical for lab environments and smaller deployments, as it reduces resource overhead.
- mc (Monitoring Console): A dedicated container for centralized monitoring of your entire Splunk deployment.
Indexer Cluster: Three indexers (idx1, idx2, idx3) form your indexer cluster, providing data redundancy and high availability. The cm (Cluster Manager) container coordinates all indexer activities and distributes configuration bundles.
Search Layer: The sh (Search Head) container queries data from the indexer cluster and presents results to users.
Data Collection: Two universal forwarders (fw1, fw2) simulate data sources that collect and forward logs to your indexers.
Browser Access: The firefox container provides a web interface to access all Splunk web UIs without complex port forwarding configurations. Access it at http://localhost:5800.
Each container runs with standardized credentials (archStudent/archStudent) and consistent permissions (PUID/PGID 1000). The Europe/Paris timezone is configured across all instances. Volume mounts persist your configurations in the ./splunk/ directory, allowing you to practice repeatedly without losing your work.
What the Practical Lab Tests
The lab scenario typically involves creating a Proof of Concept (PoC) for a customer, demonstrating specific capabilities like dashboards displaying relevant information from collected data.
You receive access to eight Linux 64-bit machines and must use internal IP addresses in your configuration files for inter-server communication, while external IP addresses allow command-line and browser access.
The typical topology includes an indexer cluster with three indexers, a cluster manager, a search head, two forwarders, and separate instances for deployment server, license manager, and monitoring console. Your Docker environment provides nine Splunk instances (matching or exceeding the actual exam), giving you comprehensive practice with every component type.
You must work independently—no coworkers can assist you in any way. However, the instructor (acting as your customer) will gladly clarify requirements if asked. You have access to materials from previous Splunk courses, the internet, Splunk documentation, Splunk Answers, and community forums—everything except another living person.
The critical aspect: The customer doesn’t know Splunk well and counts on you to know Splunk best practices. You must demonstrate not just that something works, but that it’s configured according to industry standards.
Setting Up Your Practice Environment
Before diving into the 6-day plan, set up your Docker environment:
Prerequisites: Ensure Docker and Docker Compose are installed on your system. You’ll need at least 16GB RAM for smooth operation of all nine Splunk instances.
Create the directory structure:
mkdir -p splunk/{fw1,fw2,idx1,idx2,idx3,sh,mc,cm,ds_lm}
- Create a Dockerfile :
FROM ubuntu:latest
RUN apt-get update && \
    apt-get install -y \
    sudo \
    openssh-server \
    sshpass \
    curl \
    wget \
    vim \
    net-tools \
    build-essential \
    htop \
    && apt-get clean
RUN mkdir /var/run/sshd
RUN useradd -m -s /bin/bash archStudent && \
    echo "archStudent:archStudent" | chpasswd && \
    adduser archStudent sudo
RUN sed -i 's/#PasswordAuthentication yes/PasswordAuthentication yes/' /etc/ssh/sshd_config && \
    sed -i 's/PermitRootLogin prohibit-password/PermitRootLogin yes/' /etc/ssh/sshd_config && \
    echo "PermitRootLogin yes" >> /etc/ssh/sshd_config && \
    echo "AllowUsers archStudent" >> /etc/ssh/sshd_config
EXPOSE 22
CMD ["/usr/sbin/sshd", "-D"]
- Create a docker-compose.yml in the same directory as your Dockerfile:
version: '3'
services:
  firefox:
    container_name: firefox
    image: jlesage/firefox
    ports:
      - "5800:5800"
    restart: unless-stopped

  fw1:
    build:
      context: .
    container_name: fw1
    environment:
      - PUID=1000
      - PGID=1000
      - TZ=Europe/Paris
      - PASSWORD_ACCESS=true
      - SUDO_ACCESS=true
      - USER_PASSWORD=archStudent
      - USER_NAME=archStudent
    volumes:
      - ./splunk/fw1:/opt

  fw2:
    build:
      context: .
    container_name: fw2
    environment:
      - PUID=1000
      - PGID=1000
      - TZ=Europe/Paris
      - PASSWORD_ACCESS=true
      - SUDO_ACCESS=true
      - USER_PASSWORD=archStudent
      - USER_NAME=archStudent
    volumes:
      - ./splunk/fw2:/opt

  idx1:
    build:
      context: .
    container_name: idx1
    environment:
      - PUID=1000
      - PGID=1000
      - TZ=Europe/Paris
      - PASSWORD_ACCESS=true
      - SUDO_ACCESS=true
      - USER_PASSWORD=archStudent
      - USER_NAME=archStudent
    volumes:
      - ./splunk/idx1:/opt

  idx2:
    build:
      context: .
    container_name: idx2
    environment:
      - PUID=1000
      - PGID=1000
      - TZ=Europe/Paris
      - PASSWORD_ACCESS=true
      - SUDO_ACCESS=true
      - USER_PASSWORD=archStudent
      - USER_NAME=archStudent
    volumes:
      - ./splunk/idx2:/opt

  idx3:
    build:
      context: .
    container_name: idx3
    environment:
      - PUID=1000
      - PGID=1000
      - TZ=Europe/Paris
      - PASSWORD_ACCESS=true
      - SUDO_ACCESS=true
      - USER_PASSWORD=archStudent
      - USER_NAME=archStudent
    volumes:
      - ./splunk/idx3:/opt

  sh:
    build:
      context: .
    container_name: sh
    environment:
      - PUID=1000
      - PGID=1000
      - TZ=Europe/Paris
      - PASSWORD_ACCESS=true
      - SUDO_ACCESS=true
      - USER_PASSWORD=archStudent
      - USER_NAME=archStudent
    volumes:
      - ./splunk/sh:/opt

  mc:
    build:
      context: .
    container_name: mc
    environment:
      - PUID=1000
      - PGID=1000
      - TZ=Europe/Paris
      - PASSWORD_ACCESS=true
      - SUDO_ACCESS=true
      - USER_PASSWORD=archStudent
      - USER_NAME=archStudent
    volumes:
      - ./splunk/mc:/opt

  cm:
    build:
      context: .
    container_name: cm
    environment:
      - PUID=1000
      - PGID=1000
      - TZ=Europe/Paris
      - PASSWORD_ACCESS=true
      - SUDO_ACCESS=true
      - USER_PASSWORD=archStudent
      - USER_NAME=archStudent
    volumes:
      - ./splunk/cm:/opt

  ds_lm_mc:
    build:
      context: .
    container_name: ds_lm_mc
    environment:
      - PUID=1000
      - PGID=1000
      - TZ=Europe/Paris
      - PASSWORD_ACCESS=true
      - SUDO_ACCESS=true
      - USER_PASSWORD=archStudent
      - USER_NAME=archStudent
    volumes:
      - ./splunk/ds_lm_mc:/opt
- Launch your environment:
docker-compose up -d
- Access containers: You can access any container using:
docker exec -it <container_name> bash
- Access Firefox: Navigate to
http://localhost:5800to access the Firefox browser for Splunk web UIs.
Day 1: Master the Foundation

Begin by thoroughly understanding each component’s role in the Splunk architecture. Don’t just follow instructions—understand why each step matters.
Install Splunk on each container (except the forwarders, which get Universal Forwarder):
Access each container and become the archStudent user (you should already be this user by default). Best practice is to install and run Splunk with a dedicated account that exists solely for this purpose.
Follow the official installation guide for Linux: https://docs.splunk.com/Documentation/Splunk/latest/Installation/InstallonLinux
Download Splunk Enterprise installation files using wget to /opt and extract them. For forwarders (fw1 and fw2), use the Universal Forwarder package instead, following the universal forwarder installation guide: https://docs.splunk.com/Documentation/Forwarder/latest/Forwarder/Installanixuniversalforwarder
Start Splunk and accept the license:
Follow the steps to start Splunk for the first time and accept the license agreement. Create an admin account when prompted (use admin/changeme for consistency across your lab).
Configure Splunk to run as a non-root user:
Follow the official guide: https://docs.splunk.com/Documentation/Splunk/latest/Installation/RunSplunkasadifferentornon-rootuser
Enable boot-start:
Configure Splunk to start automatically at boot time following this guide: https://docs.splunk.com/Documentation/Splunk/latest/Admin/ConfigureSplunktostartatboottime
Rename each instance:
Edit the server configuration file as described here: https://docs.splunk.com/Documentation/Splunk/latest/Admin/Serverconf#General_Server_Configuration
Day 2: License Management and Indexer Clustering

Configure the License Manager (ds_lm container):
Install a Splunk license on the ds_lm instance. For practice, request a developer license from Splunk’s website or use an enterprise trial license.
Follow the official guide to install a license: https://docs.splunk.com/Documentation/Splunk/latest/Admin/Installalicense
Add license peers:
Configure each Splunk instance (except the forwarders) to connect to your license manager following this guide: https://docs.splunk.com/Documentation/Splunk/latest/Admin/Configurealicensepeer
Configure Indexer Clustering:
Understanding indexer clustering is crucial for the practical lab. The replication factor determines how many copies of your data Splunk maintains across the cluster—typically set to 3 for production environments.
Learn about choosing the replication factor: https://docs.splunk.com/Documentation/Splunk/latest/Indexer/Thereplicationfactor
The search factor determines how many searchable copies exist—usually 2.
Configure the Cluster Manager (cm container):
Follow the official guide to configure the cluster manager with CLI: https://docs.splunk.com/Documentation/Splunk/latest/Indexer/ConfiguremanagerwithCLI
The cluster label is essential—it identifies your cluster in the monitoring console. Use a descriptive label like “prod_cluster” or “test_cluster”.
Configure each Indexer as a peer node (idx1, idx2, idx3):
Follow the guide to configure peer nodes with CLI: https://docs.splunk.com/Documentation/Splunk/latest/Indexer/ConfigurepeerswithCLI
Disable Splunk Web on indexers to reduce resource consumption:
Follow the security best practices guide: https://docs.splunk.com/Documentation/Splunk/latest/Security/DisableunnecessarySplunkcomponents
Create custom indexes through the cluster manager:
Follow the guide to configure peer indexes: https://docs.splunk.com/Documentation/Splunk/latest/Indexer/Configurethepeerindexes
Validate and apply the cluster bundle:
Follow the update peer configurations guide: https://docs.splunk.com/Documentation/Splunk/latest/Indexer/Updatepeerconfigurations
Use the commands to validate the cluster bundle, check its status, apply it to peers, and verify successful distribution. This workflow is critical—practice it until it becomes automatic.
Enable indexer discovery:
Follow the indexer discovery guide: https://docs.splunk.com/Documentation/Splunk/latest/Indexer/indexerdiscovery
Enable the receiver port on indexers:
Follow the guide to enable a receiver: https://docs.splunk.com/Documentation/Forwarder/latest/Forwarder/Enableareceiver
This is configured through the cluster manager bundle by adding the receiver configuration, then validate and apply the bundle again.
Day 3: Deployment Server and Data Collection Mastery

The deployment server (ds_lm container) centralizes configuration management for your forwarders.
Configure Deployment Server (ds_lm container):
Follow the deployment planning guide: https://docs.splunk.com/Documentation/Splunk/latest/Updating/Planadeployment
The deployment server is enabled by default on Splunk Enterprise. Create your deployment apps directory structure as described in the documentation.
Set up Deployment Clients on forwarders (fw1, fw2):
Follow the guide to configure deployment clients: https://docs.splunk.com/Documentation/Splunk/latest/Updating/Configuredeploymentclients
And the universal forwarder configuration guide: https://docs.splunk.com/Documentation/Forwarder/latest/Forwarder/Configuretheuniversalforwarder
Create deployment apps:
Follow the guide to create deployment apps: https://docs.splunk.com/Documentation/Splunk/latest/Updating/Createdeploymentapps
Create a forwarding deployment app:
Create the appropriate directory structure and configure outputs.conf with indexer discovery settings.
For load balancing configuration, follow this guide and choose volume-based load balancing: https://docs.splunk.com/Documentation/Splunk/latest/Forwarding/Setuploadbalancingd
For the forwarder side of indexer discovery, follow: https://docs.splunk.com/Documentation/Splunk/latest/Indexer/indexerdiscovery
This configuration uses indexer discovery instead of hardcoded indexer addresses and implements volume-based load balancing.
Create an inputs deployment app:
Create appropriate input configurations for monitoring log files. Reference the guide on what Splunk can monitor: https://docs.splunk.com/Documentation/Splunk/latest/Data/WhatSplunkcanmonitor
Create Server Classes:
Follow the forwarder management overview: https://docs.splunk.com/Documentation/Splunk/latest/Updating/Forwardermanagementoverview
And the guide to use forwarder management: https://docs.splunk.com/Documentation/Splunk/latest/Updating/Useforwardermanagement
Access ds_lm’s web interface through Firefox (http://ds_lm:8000) and create server classes to organize forwarders and assign deployment apps. Alternatively, you can configure serverclass.conf manually.
Verify deployment: Check the deployment server to ensure forwarders are checking in and receiving apps.
Day 4: Search Head and Comprehensive Monitoring

Configure the Search Head (sh container):
Connect the search head to the indexer cluster following this guide: https://docs.splunk.com/Documentation/Splunk/latest/Indexer/ConfiguresearchheadwithCLI
Enable indexer discovery on the search head:
Follow the indexer discovery guide: https://docs.splunk.com/Documentation/Splunk/latest/Indexer/indexerdiscovery
Forward internal logs from all components:
Forward search head data to indexers following this guide: https://docs.splunk.com/Documentation/Splunk/latest/DistSearch/Forwardsearchheaddata
On the search head, cluster manager, and ds_lm, configure outputs.conf to forward internal logs using indexer discovery settings.
You can verify forwarding configuration with: splunk list forward-server
Configure the Monitoring Console (mc container):
The monitoring console requires special configuration to properly monitor your entire deployment.
Set cluster labels:
Follow this guide to set cluster labels: https://docs.splunk.com/Documentation/Splunk/latest/DMC/Setclusterlabels
Add instances as search peers:
Follow the guide to add instances as search peers: https://docs.splunk.com/Documentation/Splunk/latest/DMC/Addinstancesassearchpeers
Access the monitoring console web UI (http://mc:8000) and go to Settings > Distributed search > Search peers to add each instance.
Configure the MC as a search head in the cluster:
If you are monitoring an indexer cluster and hosting the monitoring console on an instance other than the cluster manager, you must add the cluster manager as a search peer and configure the monitoring console instance as a search head in that cluster.
On the Cluster Manager, go to Settings > Indexer Clustering > Enable Clustering, and under Search Head, ensure that the MC is added as a search head.
If the MC is not already part of the cluster, follow this guide: https://docs.splunk.com/Documentation/Splunk/latest/Indexer/Configuresearchheadwithdashboard
Configure distributed mode:
Follow the guide to configure the monitoring console in distributed mode: https://docs.splunk.com/Documentation/Splunk/latest/DMC/Configureindistributedmode
Assign appropriate roles to each instance in your deployment.
Enable forwarder monitoring:
Follow the forwarder monitoring configuration guide: https://docs.splunk.com/Documentation/Splunk/latest/DMC/Configureforwardermonitoring
Verify monitoring: Check the monitoring console dashboards to ensure all instances appear and display health metrics.
Day 5: Advanced Operations and Troubleshooting

Practice common troubleshooting scenarios:
Scenario 1: Indexer won’t join cluster
- Check connectivity:
telnet cm 8089 - Verify pass4SymmKey matches between CM and peer
- Review splunkd.log:
tail -f /opt/splunk/var/log/splunk/splunkd.log - Confirm cluster manager is in manager mode
Scenario 2: Forwarder not sending data
- Verify deployment client connection:
/opt/splunkforwarder/bin/splunk list deploy-client - Check outputs.conf configuration
- Verify indexer receiver port is enabled
- Test connectivity:
telnet idx1 9997 - Review splunkforwarder.log
Scenario 3: Search head can’t find data
- Verify search head is connected to cluster: check cluster manager UI
- Confirm indexer discovery is working
- Run test search:
index=* | stats count by host - Check distributed search connections
Scenario 4: Monitoring console not showing cluster
- Verify cluster labels match between MC and CM
- Confirm MC is configured as search head in cluster
- Check search peer connections
- Review distributed search settings
Practice cluster bundle operations:
Make a configuration change (add a new index), validate the bundle, check for restart requirements, apply the bundle, and monitor the rollout. Practice this workflow until you can do it confidently without documentation.
Test data cleanup:
If you need to remove test data:
/opt/splunk/bin/splunk stop
/opt/splunk/bin/splunk clean eventdata -index security
/opt/splunk/bin/splunk start
Review configuration file precedence:
Understand the priority order:
- System local:
/opt/splunk/etc/system/local/ - App local:
/opt/splunk/etc/apps/<app_name>/local/ - App default:
/opt/splunk/etc/apps/<app_name>/default/ - System default:
/opt/splunk/etc/system/default/
Higher priority directories override lower priority ones. This knowledge is essential for troubleshooting configuration conflicts.
Day 6: Full Deployment Dry Run

Destroy your entire environment and rebuild from scratch:
docker-compose down
sudo rm -rf splunk/*
docker-compose up -d
Set a timer for 5 hours and complete the entire deployment:
Hour 1: Base Installation
- Install Splunk on all instances (15 minutes)
- Configure server names and boot-start (15 minutes)
- Set up license manager and add peers (15 minutes)
- Configure cluster manager and indexer cluster (15 minutes)
Hour 2: Cluster Configuration
- Add peer nodes to cluster (20 minutes)
- Create custom indexes (10 minutes)
- Validate and apply cluster bundle (10 minutes)
- Enable indexer discovery (20 minutes)
Hour 3: Deployment Server and Forwarders
- Configure deployment server (10 minutes)
- Set up deployment clients on forwarders (10 minutes)
- Create forwarding deployment app (15 minutes)
- Create inputs deployment app (10 minutes)
- Configure server classes (15 minutes)
Hour 4: Search Head and Monitoring Console
- Configure search head for cluster (15 minutes)
- Set up internal log forwarding (15 minutes)
- Configure monitoring console (20 minutes)
- Add all search peers (10 minutes)
Hour 5: Verification and Testing
- Verify cluster health (10 minutes)
- Check forwarder connectivity (10 minutes)
- Run test searches (10 minutes)
- Review monitoring console dashboards (10 minutes)
- Document any issues (20 minutes)
After completing the dry run, create a checklist of every task in order. This becomes your roadmap for the actual exam.
Critical Success Factors
Container-Specific Tips:
Your Docker environment uses container names for network communication. In your configuration files, use container names (cm, idx1, sh, etc.) instead of IP addresses. Docker’s internal DNS automatically resolves these names.
Volume Persistence:
Your configurations persist in ./splunk/ directories. If you need to reset a specific instance without destroying everything:
docker stop <container_name>
sudo rm -rf splunk/<container_name>/*
mkdir -p splunk/{fw1,fw2,idx1,idx2,idx3,sh,mc,cm,ds_lm}
docker start <container_name>
Accessing Web Interfaces:
Use the Firefox container (http://localhost:5800) to access all Splunk web UIs. From within Firefox, use container names and port 8000:
- Cluster Manager: http://cm:8000
- Search Head: http://sh:8000
- Monitoring Console: http://mc:8000
- Deployment Server/License Manager: http://ds_lm:8000
Time Management: Use the first 4 hours with the trainer wisely to ensure you understand what you should be building. Ask clarifying questions about any ambiguous requirements.
Best Practices Checklist:
- ✓ Use dedicated service accounts
- ✓ Enable boot-start on all instances
- ✓ Configure appropriate replication and search factors
- ✓ Use indexer discovery instead of hardcoded addresses
- ✓ Forward internal logs to indexers
- ✓ Properly configure monitoring console as cluster search head
- ✓ Follow naming conventions consistently
- ✓ Disable Splunk Web on indexer peers
- ✓ Validate cluster bundles before applying
- ✓ Use volume-based load balancing for forwarders
Common Pitfalls:
- Forgetting to enable receiver port on indexers
- Misconfiguring cluster labels
- Not configuring MC as search head in cluster
- Forgetting to restart splunkd after configuration changes
- Skipping cluster bundle validation
- Using wrong secret keys (cluster vs indexer discovery)
The Day of the Lab
When you start your actual practical lab, the process will be similar but with real Linux servers instead of containers. The configuration commands and best practices are identical.
Key Differences in the Real Lab:
- You’ll use IP addresses instead of container names
- You’ll receive specific server assignments from the instructor
- The instructor provides the license file location
- You’ll have specific customer requirements to meet
- Time pressure will be more intense
Your Docker practice gives you:
- Muscle memory for all configuration commands
- Understanding of component interactions
- Troubleshooting skills for common issues
- Confidence in your deployment methodology
- Familiarity with best practices
Conclusion
Your Docker-based practice environment with ten containers (nine Splunk instances plus Firefox) provides comprehensive hands-on experience that directly translates to success in the actual practical lab. The separation of the monitoring console into its own dedicated container gives you even better practice than the minimal setup, as it reflects enterprise-grade deployments.
By following this 6-day plan, you’ll develop the practical skills, troubleshooting abilities, and confidence needed to excel in the 24-hour practical lab. The Docker environment allows unlimited practice—you can destroy and rebuild your deployment as many times as needed to achieve mastery.
Start your environment today with docker-compose up -d, and remember: the key to success is understanding the “why” behind each configuration, not just memorizing commands. The practical lab tests your ability to think like a Splunk architect and make appropriate decisions based on best practices.
Good luck with your preparation and your journey to becoming a Splunk Enterprise Certified Architect!